 Burkina Faso
 Mauritania
 Cape Verde Islands
 Liberia
 Gabon
 Lesotho
 Nigeria
 Tanzania
 South Africa
 Kenya
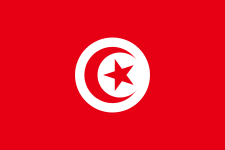 Tunisia
 Libya
 Kuwait
 Syria
 Poland U21
 Norway U21
 Llaneros
 Chico
 Czechia U18
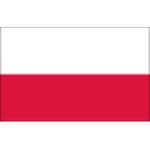 Poland U18
 Singapore
 Paraguay
 Chinese Taipei
 Kyrgyzstan
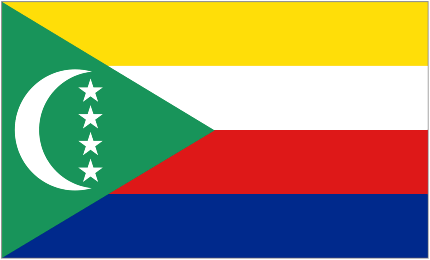 Comoros
 Congo
 Mozambique
 Ethiopia
 Zambia
 Burundi
 Congo DR U23
 Nigeria U23
 United Arab Emirates
 Honduras
 Saudi Arabia
 South Korea
 Qatar
 Australia
 Moldova
 Kazakhstan
 JS Saoura
 Khenchela
 Germany U21
 Belgium U21
 France U21
 Italy U21
 Chile U20
 Mexico U20
 Netherlands · 2026/27
Eredivisie predicted final table
10,000 simulations of the 198 remaining matches, using our Poisson model of each club's attack and defence at home and away.
| # | Club | Pts | Proj. | Win the title | Top two | Relegation play-off | Relegated |
|---|---|---|---|---|---|---|---|
| 1 | 26 | 71 | 49% |
73% |
0% |
0% |
|
| 2 | 25 | 66 | 18% |
41% |
0% |
0% |
|
| 3 | 24 | 66 | 16% |
39% |
0% |
0% |
|
| 4 | 25 | 66 | 14% |
35% |
0% |
0% |
|
| 5 | 21 | 58 | 2% |
6% |
<1% |
0% |
|
| 6 | 23 | 58 | 2% |
5% |
<1% |
0% |
|
| 7 | 20 | 53 | <1% |
1% |
<1% |
0% |
|
| 8 | 15 | 48 | <1% |
<1% |
1% |
0% |
|
| 9 | 15 | 46 | <1% |
<1% |
1% |
0% |
|
| 10 | 17 | 45 | <1% |
<1% |
2% |
<1% |
|
| 11 | 14 | 43 | 0% |
<1% |
4% |
<1% |
|
| 12 | 10 | 38 | 0% |
0% |
18% |
1% |
|
| 13 | 12 | 38 | 0% |
0% |
19% |
<1% |
|
| 14 | 9 | 35 | 0% |
0% |
31% |
1% |
|
| 15 | 12 | 35 | 0% |
0% |
33% |
1% |
|
| 16 | 11 | 34 | 0% |
0% |
41% |
1% |
|
| 17 | 12 | 34 | 0% |
0% |
45% |
2% |
|
| 18 | 3 | 18 | 0% |
0% |
6% |
94% |


















Proj. = average final pointsRight-hand grid: % chance of finishing in each positionUpdated 16:35 UKMethodology
Probabilities describe what our model expects, not what will happen. Points deductions, injuries and transfers are not modelled. This is sports analysis, not betting advice.